Nowadays, OpenTelemetry is becoming an industry standard in the observability world. More and more systems need to be monitored to prevent downtimes and keep the availability of the services. In this article, we will show how to set up and visualize data exported from the OpenTelemetry’s Collector and transport them into Datadog, a popular monitoring platform.
Observability
In general, observability in IT is an ability to check the status of an application using external data. Three basic components used to observe the application are logs, traces, and metrics. We can say that our application is “observable” if we can determine the internal status of the application based on the outgoing data. Nowadays, we can get data by endpoints or services from almost every application, service, or hardware, especially in the cloud environment. Output may contain multiple types of information, such as payloads, operation times, or even custom data. Based on them, we should know the internal status of the application or infrastructure. Observability, combined with platforms like Datadog and tools like OpenTelemetry, allows us to detect application, infrastructure issues, network traffic, data leaks, or measure performance. These data are crucial for our infrastructure to keep it accessible, efficient, and error-free.
What is OpenTelemetry
OpenTelemetry is a 100% free and Open Source collection of tools that allow you to collect and export monitoring data from your distributed system. Then you can use these data to monitor the performance of your application in a production environment.
Traces
Traces let us see what happened to the request that was sent to your application. In case of any issues, we can investigate the request step by step and see what could have caused the problem.
Spans
Each trace stores operations (functions, database calls, etc.) that are executed during the request. Those operations are saved in the request context as spans. Such elements are the basic building blocks of the trace. Spans collected within one request context have the same trace ID. Thanks to that, everything is tied together, which makes it easier to debug specific requests.
Metrics
A metric is a numerical representation of specific characteristics of services that are captured during the runtime of the service. Metrics are a good indicator of application’s performance and availability. For instance, we can use them to see which part of the system is used the most or what the database query rate is. Furthermore, based on them, we can prepare alerting tools that will notify us about potential issues with the application as well as take action to prevent the downtime.
Logs
A text record representing a specific event that occurred in the system. Logs are a great way to debug your application in the production environment. Logs can be either independent or attached to a specific span. In OpenTelemetry, everything that is not treated as trace or metric is treated as logs.
What is Datadog
Datadog is a platform created for monitoring cloud-scale applications. The platform provides the ability to observe, monitor, and measure elements of the application, e.g., databases, tools, or other services through a SaaS (software as as service) model.
Datadog provides the following core features:
- Database monitoring
- Network monitoring
- Gathering logs and traces
- Error tracking
- Multiple dashboards for visualizing data
Created as a solution for cloud applications, Datadog has support for multiple cloud services:
- AWS
- Google Cloud Platform
- Microsoft Azure
- Red Hat OpenShift
In addition, Datadog offers us the ability to connect to more than 400 built-in integrations with applications or services and to display the collected data. It also has many ready for use dashboards. Furthermore, Datadog can be integrated with applications created for Linux, Mac, or Windows operating systems.
You can find more information on supported integrations here: https://docs.datadoghq.com/integrations/
Integrating OpenTelemetry and Datadog
There are two major ways to integrate OpenTelemetry and Datadog:
- We can configure OpenTelemetry Collector to use the Datadog exporter.
- We can enable OpenTelemetry Protocol ingestion through the Datadog Agent.
The first one requires you to set up a container with OpenTelemetry’s Collector and is recommended when starting configuring OpenTelemetry from scratch. On the other hand, the other one uses the Datadog Agent application as the collector. It’s best to use this approach when you already have the Datadog Agent container up and running in your environment. All in all, we will show you both of them!
OpenTelemetry Collector configuration with the Datadog exporter
To configure OpenTelemetry, we need to set up the OpenTelemetry’s Collector, which is a critical component. It serves as a middleman between the data sources communicating with the OpenTelemetry Protocol and the backends where the data will be transferred, such as Datadog. Without it, we cannot use exporters to send data to Datadog. The most basic Collector’s configuration file should contain the following objects:
receivers:
  otlp:
    protocols:
      grpc:
      http:

processors:
  batch:

exporters:
  datadog:
    api:
      site: ${DD_SITE}
      key: ${DD_API_KEY}

service:
  pipelines:
    traces:
      receivers: [otlp]
      processors: [batch]
      exporters: [datadog]
    metrics:
      receivers: [otlp]
      processors: [batch]
      exporters: [datadog]
First of all, we need to configure the receivers. Receivers are used to get the data into the Collector. Most receivers come with default configuration and are good to go instantly after having been specified. Our example will receive data via HTTP and gRPC using OpenTelemetry Protocol format:
receivers:
  otlp:
    protocols:
      grpc:
      http:
The next step is to configure the processors. According to the documentation, a processor is a component that operates between receivers and exporters. The processor’s aim is to format the data obtained from the receiver so the exporter can send the well-formatted data to the service that will use the data. In our example, we will use batch processors, which are highly recommended on every OpenTelemetry Collector. As the official documentation states:
Batching helps better compress the data and reduce the number of outgoing connections required to transmit the data
processors:
  batch:
Now it’s time to configure the destination of the Collector’s data. For the data, we will use Datadog. By adding Datadog to the exporters section, we point to the OpenTelemetry’s Collector where the data should be sent:
exporters:
  datadog:
    api:
      site: ${DD_SITE}
      key: ${DD_API_KEY}
Values ${DD_SITE} and ${DD_API_KEY} are declared as environment variables.
Last thing left! In the service section, we need to enable which components will be used by the Collector. If we don’t do that in advance, the configuration won’t work! The service object contains three sub-sections:
- telemetry – configuration of telemetry of the Collector itself.
- pipelines – describes which
receivers,processors, andexporterswill be used forlogs,traces, andmetrics. - extensions – list of extensions to enable in the Collector.
service:
  telemetry:
    logs:
      level: "debug"

  pipelines:
    traces:
      receivers: [otlp]
      processors: [batch]
      exporters: [datadog]
    metrics:
      receivers: [otlp]
      processors: [batch]
      exporters: [datadog]
Running OpenTelemetry Collector using Docker
We used docker-compose to run OpenTelemetry’s Collector with the following configuration:
otel-collector:
    image: otel/opentelemetry-collector-contrib
    command: ["--config=/etc/otel-collector-config.yaml"]
    volumes:
      - ./otel-collector-config.yaml:/etc/otel-collector-config.yaml
    ports:
      - "4317:4317"   # OTLP gRPC receiver
      - "4318:4318"   # OTLP http receiver
    environment:
     - DD_API_KEY=DATADOG_API_KEY
     - DD_SITE=DATADOG_SITE
    networks:
      otel-research:
Three important points should be highlighted:
- We have indicated where the config file is located under the
volumessection. - We specified the startup
commandpointing to files copied by the Docker volumes. - We added Datadog environment variables that can be injected into the configuration file.
Now, we need to set OTEL_EXPORTER_OTLP_ENDPOINT pointing to the OpenTelemetry’s Collector (either using 4317 or 4318 port, depending if you want to use gRPC or HTTP protocol).
OpenTelemetry Protocol ingestion in the Datadog Agent
You don’t always have to use OpenTelemetry’s Collector to gather OTLP data. Instead, we can use OTLP ingestion in the Datadog Agent, which will send the data straight to the Datadog service. This is extremely useful when we already have the Datadog Agent configured and we want to enable OpenTelemetry as well, without having to add another container to the environment.
In order to configure the OTLP ingestion in the Datadog Agent, we need to provide two following environment variables:
DD_OTLP_CONFIG_RECEIVER_PROTOCOLS_GRPC_ENDPOINTDD_OTLP_CONFIG_RECEIVER_PROTOCOLS_HTTP_ENDPOINT
The first one tells Datadog to open the receiver for the gRPC endpoint on the specified host and port (e.g., 0.0.0.0:4317). The other one is used to open the receiver for the HTTP endpoint on the specified host and port (e.g., 0.0.0.0:4318).
Now, we will be able to gather OTLP data inside the Datadog Agent. We just need to make sure that OTEL_EXPORTER_OTLP_ENDPOINT is pointing to the Datadog Agent instead of OpenTelemetry’s Collector.
The entire Datadog Agent container configuration should look like this:
otel-datadog:
  image: datadog/agent:latest
  pid: host
  ports:
    - "5000:5000"
    - "5003:5003"
    - "8125:8125"
    - "6162:6162"
    - "8126:8126"
    - "4319:4317"
    - "4320:4318"
  environment:
    - DD_API_KEY=""
    - DD_SITE=datadoghq.eu
    - DD_DOGSTATSD_NON_LOCAL_TRAFFIC=true
    - DD_APM_ENABLED=true
    - DD_OTLP_CONFIG_RECEIVER_PROTOCOLS_GRPC_ENDPOINT=0.0.0.0:4317
    - DD_OTLP_CONFIG_RECEIVER_PROTOCOLS_HTTP_ENDPOINT=0.0.0.0:4318
    - DD_OTLP_CONFIG_TRACES_ENABLED=true
  volumes:
    - /var/run/docker.sock:/var/run/docker.sock
    - /proc/:/host/proc/:ro
    - /sys/fs/cgroup:/host/sys/fs/cgroup:ro
Basic example with Flask
In this paragraph, we will illustrate how to connect everything together with an actual application. For this purpose, we will create a simple hello-world Flask application with one endpoint that we will monitor.
Installing necessary libraries
First, we will need to install OpenTelemetry SDK libraries that will help us instrument our application:
Flask==2.2.0
opentelemetry-api==1.12.0
opentelemetry-sdk==1.12.0
opentelemetry-exporter-otlp==1.12.0
opentelemetry-instrumentation-flask==0.33b0
If you want to use the HTTP protocol, you might want to install the opentelemetry-exporter-otlp-proto-http library instead of opentelemetry-exporter-otlp that uses the gRPC protocol.
Connecting Flask app and OpenTelemetry
from flask import Flask
from opentelemetry import trace
from opentelemetry.exporter.otlp.proto.grpc.trace_exporter import OTLPSpanExporter
from opentelemetry.instrumentation.flask import FlaskInstrumentor
from opentelemetry.sdk.resources import Resource
from opentelemetry.sdk.trace import TracerProvider
from opentelemetry.sdk.trace.export import BatchSpanProcessor


app = Flask(__name__)

resource = Resource(attributes={"service.name": "example_service"})

otlp_exporter = OTLPSpanExporter(insecure=True)
tracer_provider = TracerProvider(resource=resource)
span_processor = BatchSpanProcessor(otlp_exporter)
tracer_provider.add_span_processor(span_processor)
trace.set_tracer_provider(tracer_provider)

FlaskInstrumentor().instrument_app(app)


@app.route("/hello", methods=["GET"])
def hello():
   return "Hello", 200
Above, the code will assign OpenTelemetry tracer with BatchSpanProcessor to the entire Flask application. This will allow us to trace the application and see traces in the Datadog website after entering the hello endpoint.
Connecting to Collector or the Datadog Agent
The OTEL_EXPORTER_OTLP_ENDPOINT environment variable sets the collection endpoint to which all telemetry data will be published. By changing it, you can use either the OpenTelemetry Collector’s approach or the standalone Datadog Agent shown previously.
Running the application
Next you have to run the Flask application. For example, we could create the following script to run the app:
#!/bin/sh

pip install -r requirements.txt

export FLASK_DEBUG=1
export FLASK_APP=app.py

flask run --host=0.0.0.0 --port=9000
Next you can go to your browser and enter http://localhost:9000/hello to run the example endpoint. After that we can see a new trace in the Datadog panel:
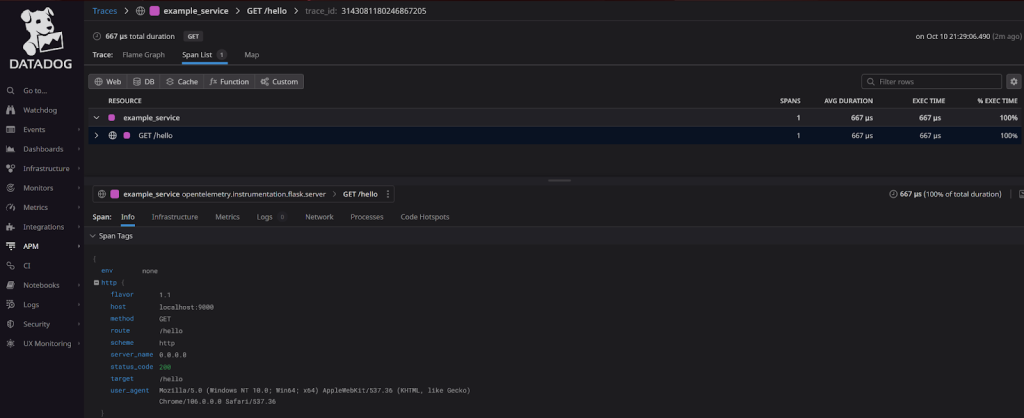
You can find the entire example here: https://github.com/kaniak274/OpenTelemetryFlaskExample
Conclusion
Observability and monitoring are extremely important for debugging and analyzing issues inside your system when it’s up and running in the production environment. Instead of mails from the client, you will be able to fix bugs or performance issues much faster, knowing about them early on. Datadog and OpenTelemetry together create an excellent solution, providing you with a lot of insight that will allow you to react more quickly and provide a rapid and reliable reply to your client.
And if you need a development team that cares about availability and robust monitoring…
Let’s talk!
Kamil Supera, a stalwart Backend Developer and Tester at Makimo, deftly channels his passions into curating insightful articles on the intricacies of testing and AWS. With Python as his mainstay, Kamil weaves a realm where logic meets magic, advocating for continuous enhancement and striking to the root of every problem. Often found sharing his industry wisdom on Makimo's blog, he acts as a guardian for quality and an enchanter of codes. When not immersed in digital complexities, he retreats to nature's sanctuary, embracing the tranquility of trees and streams far from urban clamor. Kamil's enduring fascination for problem-solving, coupled with his love for the great outdoors, defines his unique perspective, both as a professional and an individual.

Kamil Kucharski is a dedicated Backend Developer at Makimo, constantly exploring the dynamic terrain of DevOps, AWS, and Software Architecture. A fearless hero in the tech world, he confidently navigates his way through complex challenges, often sharing his insightful discoveries through articles on Makimo’s blog. Guided by his passion for Python and Clojure, he continually seeks the right tool for every unique challenge. Outside of his professional journey, Kamil channels his energy into mastering the art of Kendo, embodying the fearlessness and heroism he expresses at work.