Say hello to MARY – an open-source, multilingual Text-to-Speech Synthesis platform written in Java! Our paths crossed by the courtesy of a friend from one of the Vanderbilt University research teams. One day we got a message:
Makimo! Your mission, should you choose to accept it, is to illustrate MARY’s basic output using a curve with nodes indicating changes in the sound pitch.
MaryTTS can not only speak English (both American and British), Telugu, German, French, Russian, Italian, Swedish, Luxembourgish or Turkish, and apply effects like a whisper, robot speech, or jet pilot. Some voices can generate additional vocalizations such as laughter, ‘hmmm,’ or ‘yeah’. The German Research Center for Artificial Intelligence hosts a publicly available web client you can say hello to.
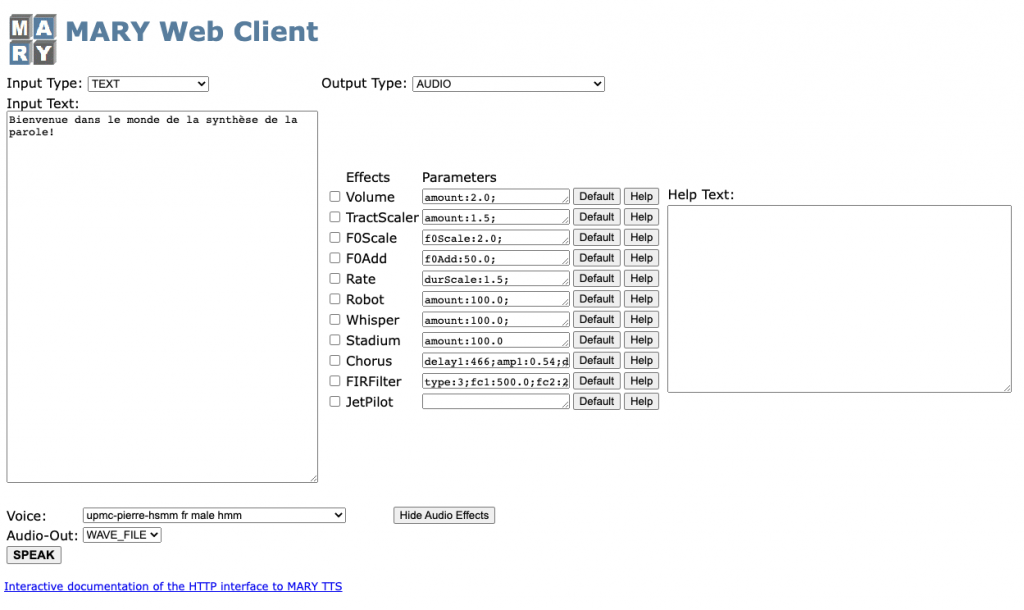
So many options and possibilities, but no imaging. And hardly any refinement for the user interface, clearly designed to test the features, and not face the end-users. We couldn’t miss the opportunity to give this voice a nice shape.
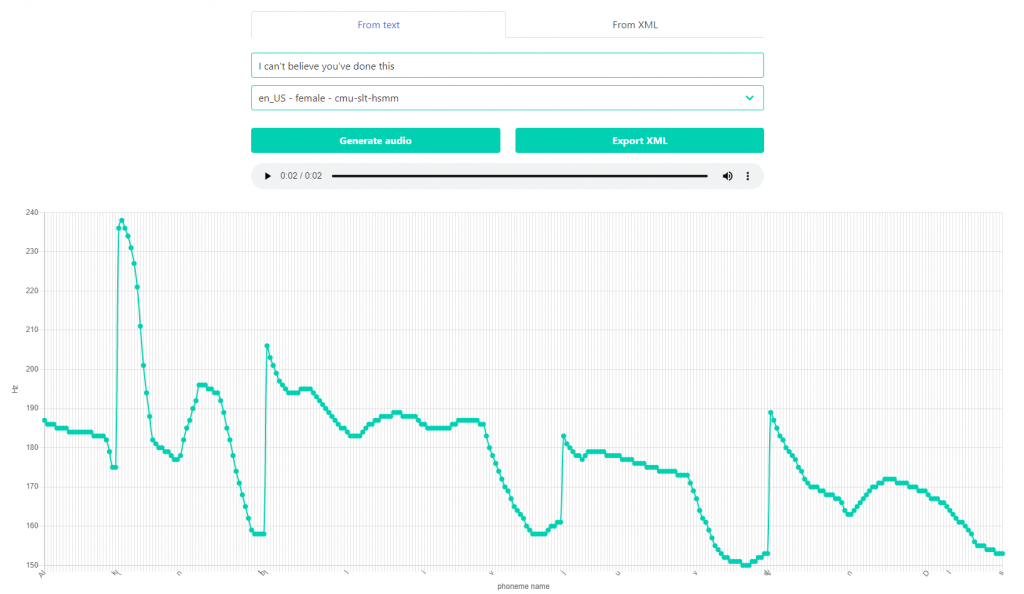
The very first proof of concept was assembled with standard components from the Bulma framework and the chart.js library, and it basically worked as it was supposed to.. Users could enter any text and generate an audio waveform using the selected voice. The synthesis result was a playable audio file and a chart with the phoneme plot shown on screen.

Having that ready to play with, ideas started trickling in. It all started modestly by adding support for handling XML files, both import and export, as an addition to just the text input. It might not seem revolutionary, but unlike the original MARY Web Client, users could finally save the synthesis results, share and load again anytime they wanted.
Just showing things is fun and all, but the research group’s goals were set on experimenting with changing things, and it was grist to the mill of our creativity. The next feature that came along was an option to modify the pitches of the individual phonemes and hear the results afterwards.
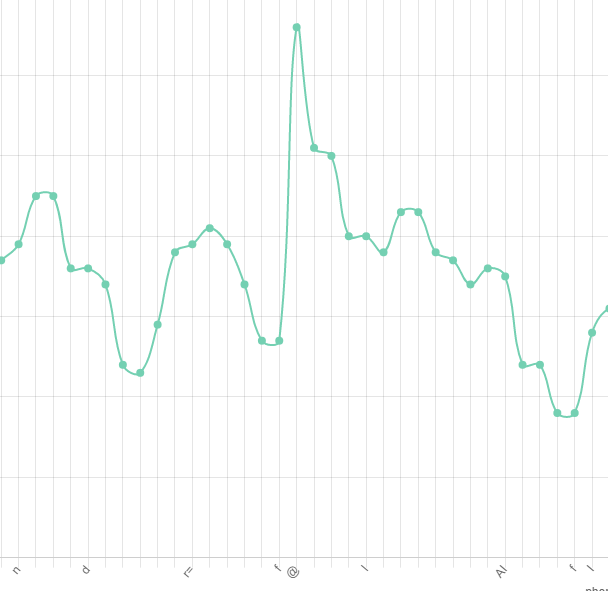
It was impossible with the curve tightly packed with nodes. No one wanted to expand the chart ad infinitum or add a horizontal scroll that — with the sheer number of points — wouldn’t help much anyway. Therefore, to make the transformations possible, we added an option to simplify the curve to reflect only the significant changes in the pitch, retaining the original shape.
The client must have felt encouraged to push the transformations even further as they came up with a couple more feature ideas. One of them was the ability to depict the moments of silence on the chart, and the other involved exchanging phonemes on the simplified curve.
At that time, our rendition of the MARY interface was still a proof-of-concept mainly in the hands of developers validating if such things could be done, plastering additional tabs and controls from the Bulma library around as the requests came by. We reached the point when we wanted to stop and do some whiteboarding rather than mindlessly glue more buttons.
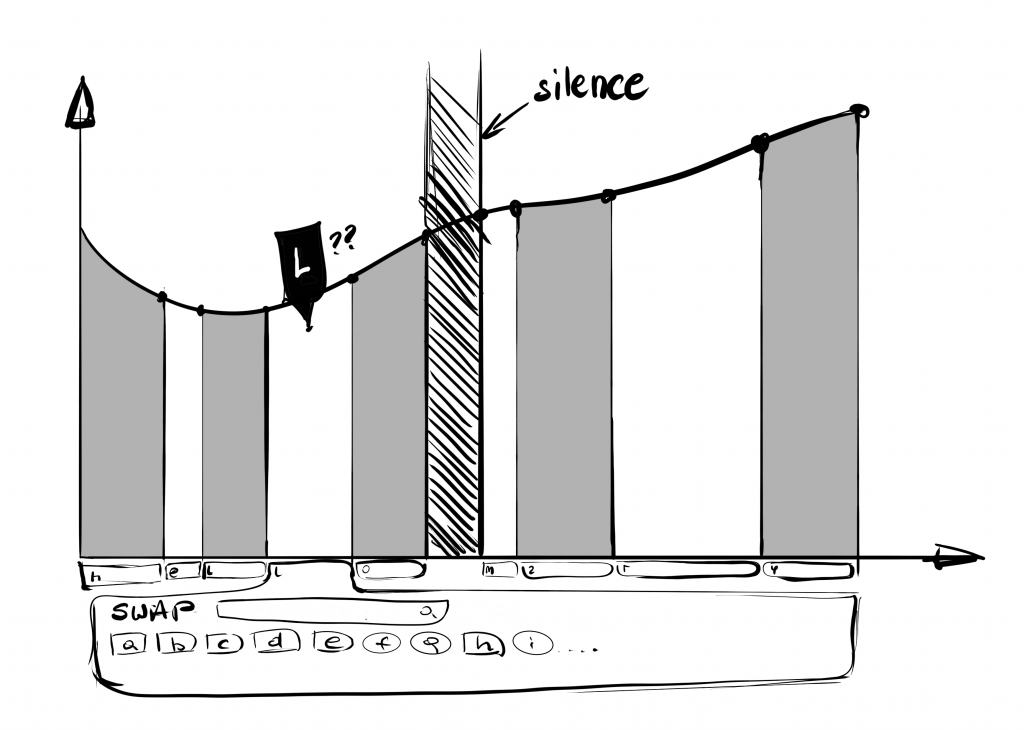
The first idea for swapping phonemes revolved around showing some kind of floating window after clicking each character’s area on the chart. But that wasn’t the most intuitive as the curve presented the synthesized text as a whole, with little distinction between adjacent speech sounds.
Instead, we filled the area under the wave with alternating colours and added a block of diagonal lines – to enhance the accessibility – for the moments of silence representing its duration. The area belongs to phonemes and their duration, while handles are bound only to the pitch and the shape of the curve.
Alternating colours of the phonemes quickly reminded us of a good ol’ Excel sheet and its column headings. Therefore, we equipped each phoneme with a box containing its symbol. When clicking the box, a list of phonemes appears from which the user can search and select one for exchange. This approach also leaves plenty of space for other advanced editing features that might come in the future.
With all points covered, we converted our drafts and conclusions into an actual user interface. We did away with the barebone Bulma components and chart.js, this time settling for a custom-made interface and a chart implemented from ground-up using the D3.js framework.

Hovering a pointer over the handle triggers a tooltip with the exact sound frequency of that point. The user can grab the node and move it up or down to change its pitch. No worries if the explorations go too far! There’s always a trace of the original wave plotted in the background as a reference.

It’s almost impossible and often unnatural to change just one isolated phoneme since the human voice is not adapted to abrupt pitch changes and the resulting speech would sound choppy and weird. Changing one pitch typically affects neighbouring sounds too. To solve this, we added a segmented slider where the user can define the range of influence from 0 to 10 handles. Changing any pitch affects the phoneme wave like a fabric, smoothly moving adjacent pitches.
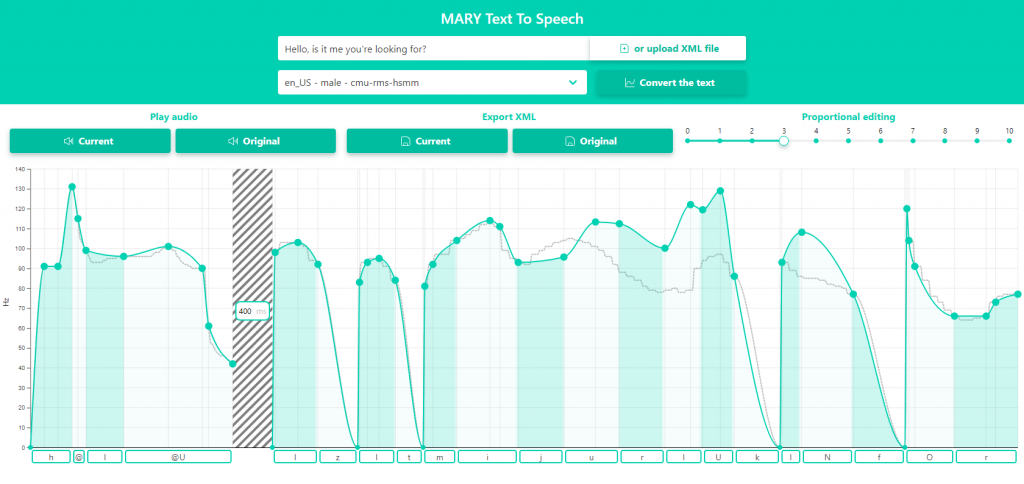
We also cleaned up the whole user interface a bit. One of the first versions of the prototype had a text field and XML import on two separate tabs. We merged them into one input group and gathered them on top of the page along with voice selection and the “Convert the text” button. We considered dropping the button and making the synthesis totally reactive, but it would be too easy to mistakenly wipe out all the work. Since the only way to save the edited wave is to export it to an XML file, we avoided that.
The light background of our MARY now defines the space for displaying and editing the phoneme wave. Users might want to easily hear the effect compared to the original sound, so we left those previews available within one click. Not only do the two buttons lie in plain sight, but also the “Current” audio is generated instantly after each adjustment. Having plenty of space to spare, we decided to keep the “Export XML” buttons separate.
As a result of this extreme makeover, we made the aims of Vanderbilt University’s research team come true. Now they can easily visualise the speech contours and perform experiments on the intonation.
Last but not least, the new and more robust implementation of the charting features could easily cope with data exchange formats exposed directly by the MARY server. Because of that, the backend service — responsible for transforming MaryXML documents to be easily digested by chart.js we had in the proof-of-concept — was put away. The whole app is now directly connected to the MARY server, making it leaner and more future proof if the research team comes with more ideas. We are eager to hear them!
And if you’d like to improve your application step-by-step…
Let’s talk!P.S.
No Sketch file was harmed in the making of this interface. Even though most of the components were eventually custom-made, we saved time and money by limiting the creative work to whiteboarding and rapid prototyping in the browser.

Head of UX who loves making sense of noise, searching for trends and inspirations, and exploring the humane face of technology. Justyna shares her passion not only within Makimo but also as a lecturer at UEHS, Warsaw, and a co-host of the Let the Tech Out podcast. She writes her own story not only using words and pixels but also brush strokes, seams, knitting stitches, yoga asanas and running miles.